CoreLogic: US Home Prices Increased 5.3% Year-over-year in March
- Details
- Created: Monday, 06 May 2024 12:00
- Written by Calculated Risk
Notes: This CoreLogic House Price Index report is for March. The recent Case-Shiller index release was for February. The CoreLogic HPI is a three-month weighted average and is not seasonally adjusted
(NSA).
From CoreLogic: Northeast Continues to Lead US for Annual Home Price Gains in March, CoreLogic Reports
• U.S. single-family home prices rose by 5.3% year over year in March, marking the 146thconsecutive month of annual growth.This was a smaller YoY increase than the 5.5% reported for February, and the 5.8% YoY increase reported for January.• Over the next 12 months, year-over-year home price gains are projected to range between 5.6% and 3.7%.
• Four of the top five states for annual appreciation in March are in the Northeast: New Jersey (12.2%), New Hampshire (10.6%), Connecticut (9.5%) and Rhode Island (9.2%).
...
U.S. year-over-year home price gains remained above 5% in March for the fifth straight month and are projected to stay in that general range for most of the next 12 months. Northeastern states continued to post the nation’s largest gains, as more Americans migrate to bedroom communities of major cities and job hubs, as well as areas where household incomes are relatively higher and can sustain the elevated cost of homeownership. In addition, the inventory gains seen in states like Florida and Texas still lag in the Northeast, a trend that continues to exacerbate supply-and-demand fundamentals and further adds to home price pressure in that region. Consequently, markets with larger additions of homes for sale are now experiencing slowing home price appreciation.“Home prices increased again this March beyond the typical seasonal uptick, despite mortgage rates reaching this year’s high and the affordability crunch continuing to keep many prospective buyers on the sidelines,” said Dr. Selma Hepp, chief economist for CoreLogic. “Even with the long-anticipated break in for-sale inventory, the surging cost of homeownership, further fueled by rising insurance and tax expenses, is holding potential home sales back, as is evident in the slow rise in sales compared with last year. These price pressures reflect the overall supply-and-demand mismatch, as well as continued interest from households with larger budgets.”
emphasis added
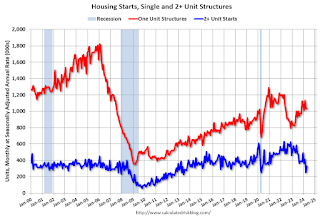 At the Calculated Risk Real Estate Newsletter this week: Click on graph for larger image. • Single Family Starts Up 18%
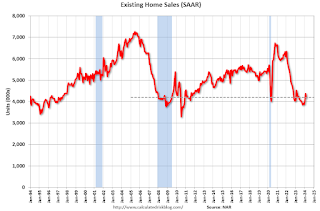 The key reports this week are April New and Existing Home Sales. ----- Monday, May 20th ----- 10:30 AM: Speech, Fed Vice
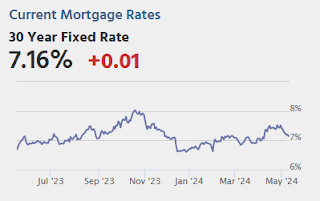 Note: Mortgage rates are from MortgageNewsDaily.com and are for top tier scenarios. For deaths, I'm currently using 4 weeks ago
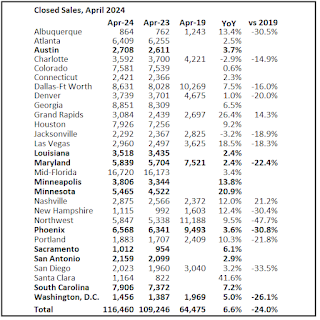 Today, in the Calculated Risk Real Estate Newsletter: Lawler: Early Read on Existing Home Sales in April & 3rd Look