Realtor.com Reports Active Inventory Up 35.1% YoY; New Listings Up 3.6% YoY
- Details
- Created: Wednesday, 08 May 2024 15:30
- Written by Calculated Risk
What this means: On a weekly basis, Realtor.com reports the year-over-year change in active inventory and new listings. On a monthly basis, they report total inventory. For April, Realtor.com reported inventory
was up 30.4% YoY, but still down almost 36% compared to April 2017 to 2019 levels.
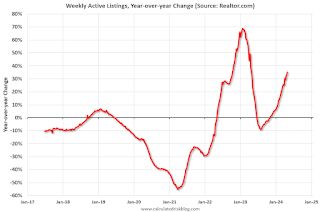
Realtor.com has monthly and weekly data on the existing home market. Here is their weekly report: Weekly Housing Trends View—Data for Week Ending May 4, 2024
• Active inventory increased, with for-sale homes 35.1% above year-ago levelsFor the 26th straight week, there were more homes listed for sale versus the prior year, giving homebuyers more options. As mortgage rates have climbed to new 2024 highs, we could see sellers adjust their plans, since nearly three-quarters of potential sellers also plan to buy a home. However, the long buildup to listing—80% have been thinking about selling for 1 to 3 years—could mean that this year’s sellers are less deterred by market fluctuations.
• New listings—a measure of sellers putting homes up for sale—were up this week, by 3.6% from one year ago
Although the number of new listings kept rising, the rate of increase slowed considerably compared with the double-digit surges seen in recent weeks. This slowdown highlighted the extent to which sellers’ sentiments are influenced by mortgage rates.
As mortgage rates breach 7% once more, numerous home sellers might be inclined to postpone their selling endeavors. Should mortgage rates persist in their ascent, they will continue to suppress listing activities.
 Here is a graph of the year-over-year change in inventory according to realtor.com.
Inventory was up year-over-year for the 26th consecutive week.
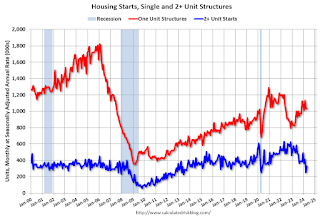 At the Calculated Risk Real Estate Newsletter this week: Click on graph for larger image. • Single Family Starts Up 18%
 The key reports this week are April New and Existing Home Sales. ----- Monday, May 20th ----- 10:30 AM: Speech, Fed Vice
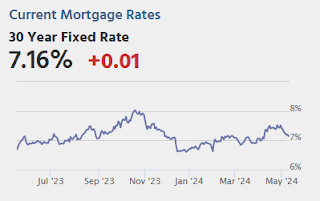 Note: Mortgage rates are from MortgageNewsDaily.com and are for top tier scenarios. For deaths, I'm currently using 4 weeks ago
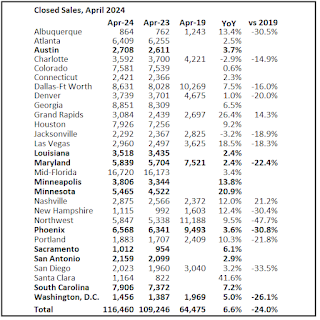 Today, in the Calculated Risk Real Estate Newsletter: Lawler: Early Read on Existing Home Sales in April & 3rd Look